fioコマンド
はじめに
AWSのディスクI/0の高速化をテーマにした実践をするために、 まずは、その実践で使うディスクI/Oを計測するベンチマーク測定ツール「fioコマンド」についてお勉強。
fioコマンドとは
由来
flexible I/O tester
FileI/Oの略なんだと思ってたら、 「flexible I/O tester」の略なんだと。
作者・開発元
Jens Axboe
WikiPediaによるとLinuxカーネルのハッカーらしい。今はORACLEに在籍している様子。 1976年生まれ。(近い!同じ世代でこんなもの作っちゃう人。同じ人間に思えない。)
最新バージョン
2.6(記事投稿時点での最新)
Releases · axboe/fio · GitHub によると、記事投稿日から18日前に2.6がリリースされている様子。
概要
- ディスクI/Oに負荷をかけるためにスレッドやプロレスをうじゃうじゃ起動でき、設定された分のFIOの負荷をかけることができる。
- linux版だけでなく、windows版もある。http://www.bluestop.org/fio/
コマンド構文
fio [options] [jobfile]...
コマンドオプション
- --debug
- Enable some debugging options (see below)
- デバックモードにする
- --parse-only
- Parse options only, don't start any IO
- 決められたフェーズのみ負荷をかける設定ができる?っぽい。
- --output
- Write output to file
- 結果出力先の指定
- --runtime
- Runtime in seconds
- 実行時間の指定
- --bandwidth-log
- Generate per-job bandwidth logs
- 1ジョブごとに帯域幅を測定する
- --minimal
- Minimal (terse) output
- 最小の簡易出力
- --output-format=type
- --terse-version=type
- Terse version output format (default 3, or 2 or 4).
- 簡単モードで使うバージョン?
- --version
- Print version info and exit
- バージョン情報の出力
- --help
- Print this page
- ヘルプ
- --cpuclock-test
- Perform test/validation of CPU clock
- CPUクロックの確認をする
- --crctest[=test]
- Test speed of checksum functions
- チェックサムのテスト時間を計測する
- --cmdhelp=cmd
- Print command help, "all" for all of them
- コマンドのヘルプ。
- --enghelp=engine
- Print ioengine help, or list available ioengines
- エンジンのヘルプを出力する。
- --enghelp=engine,cmd
- Print help for an ioengine cmd
- エンジンのヘルプを出力する?
- --showcmd
- Turn a job file into command line options
- ジョブファイルにコマンドラインオプションの内容を追加する?
--eta=when
- When ETA estimate should be printed May be "always", "never" or "auto"
- 終了予定時間を出力する
--eta-newline=time Force a new line for every 'time' period passed
--status-interval=t Force full status dump every 't' period passed
--readonly
- Turn on safety read-only checks, preventing writes
- 読み取り処理のみチェック。書き込みを防ぐことができる。
- --section=name
- Only run specified section in job file
- ジョブファイルのしていされたセクションだけ実行する
- --alloc-size=kb
- Set smalloc pool to this size in kb (def 1024)
- 表示されるサイズ?
- --warnings-fatal
- Fio parser warnings are fatal
- warningはfaitalとして扱うか?
- --max-jobs=nr
- Maximum number of threads/processes to support
- 最大のスレッド・プロセス数
- --server=args
- Start a backend fio server
- 処理を開始するサーバ
- --daemonize=pidfile
- Background fio server, write pid to file
- バックグラウンドで実行するか?
- --client=hostname
- Talk to remote backend fio server at hostname
- リモートにあるサーバで実行する場合のホスト名指定
- --idle-prof=option
- Report cpu idleness on a system or percpu basis (option=system,percpu) or run unit work calibration only (option=calibrate)
- ?
- --inflate-log=log
- Inflate and output compressed log
- ログが増えたら圧縮する
- --trigger-file=file
- Execute trigger cmd when file exists
- ファイルで起動する場合のトリガーファイル。(ファイルが存在すれば実行する)
- --trigger-timeout=t
- Execute trigger af this time
- 時間で起動する場合のトリガー時間。
- --trigger=cmd
- Set this command as local trigger
- ?
- --trigger-remote=cmd Set this command as remote trigger ?
- --aux-path=path
- Use this path for fio state generated files
- ?
ジョブファイルのパラメータ
ここではよく利用しそうなもののみ紹介します。
すべてのパラメータを知りたい場合はこちらへ
ジョブファイル記述例
[random-read]→コメント
rw=randread
size=100m
directory=/home/test/fio/
| パラメータ名 | 設定例 | パラメータ説明 |
|---|---|---|
| rw | rw=str | fioで読み書きする方法。詳細はこちらへ。 設定できる値は、read,write,randwrite,randread,rw,readwrite,randrw,trimwriteがある |
| randrepeat | randrepeat=bool | ランダムアクセスを規則的に行うか?設定できるっぽい。 ランダムアクセスでのベンチマークをするときにはfalseにしたほうがよさそう |
| randseed | randseed=int | ここで設定された値をもとに、乱数を発生させて、ランダムアクセスするらしい。 |
| ioengine | ioengine=str | IOをどう行うか決める。デフォルトはsync(同期I/O)になる。 syncかlibaioを使うことが多い様子。 Nullはデバックやテスト目的で利用。 |
| size | size=int | この測定で読み書きするファイルサイズ。 Job全体のIOサイズ。 単位はb。, 64{k,M, G, T, P}, 10% など |
| percentage_random | percentage_random=int | どのくらいの割合でランダムにするか設定できる。 100%にするとすべてランダム、0%だとすべてシーケンシャルになる。 読み取り、書き込み、トリムそれぞれに値を設定できる。 設定例:読み取りに50%書き込みに100%トリムは0%の場合は 「percentage_random=50,100,0」。 |
| nrfiles | nrfiles=int | このジョブで利用するファイル数を設定できる。デフォルトは1。 |
| overwrite | overwrite=bool | ファイルへの書き込みを上書きとするか、 全削除して新規書き込みとするかの選択。 1=true=上書きする。デフォルトは1(true) |
| runtime | runtime=time | 実行最大時間。単位はseconds(秒) |
| buffered | buffered=bool | バッファを利用するか否か。デフォルトは1(true) |
| iomem,mem | iomem=str,mem=str | バッファとして利用するメモリーのタイプ。 以下が選択できるらしい。 malloc 、shm 、shmhuge 、mmap 、mmaphuge 、mmapshared |
| verify_only | 実際の計測はしないで、確認用のモード。 | |
| lockmem | lockmem=int | 指定された量のメモリを未使用にできるらしい。メモリの少ない状態をシュミレートできるとのこと。 |
| rwmixread | rwmixread=int | 読み書きの割合。設定例:-rwmixread=70 70%read, 30%write |
| rwmixwrite | rwmixwrite=int | rwmixreadと一緒で引数の意味が逆なだけ |
| nice | nice=int | このコマンドのCPU優先順位を決定する。 ナイス値は-20~19であり-20がもっとも優先される。 デフォルトは10。 |
| rate | rate=int | ジョブで使用される帯域幅。数はバイト/秒。 |
| ratemin | ratemin=int | 最低限維持する帯域幅。 これを下回るとジョブが途中終了し失敗扱いになる。 |
インストール
fioのインストール
yum install fio
fioのバージョン確認
fio -v
> [ec2-user@ip-172-31-26-155 ~]$ fio -v
> fio-2.1.5
使い方
- fioで読み書きするディレクトリを決める。または対象のディレクトリを作成する。
今回は、「/tmp/fio-test/」にします。 - jobファイルを作成して、必要なパラメータを記述する。今回は以下を設定。
[sample]
rw=randread
size=256m
directory=/tmp/fio-test
- fioコマンドを実行する。
[ec2-user@ip-172-31-26-155 fio-benchmark]$ fio /home/ec2-user/fio-benchmark/sample.job
- 結果を検証する。
結果を見る
実行中ログ
sample: (g=0): rw=randread, bs=4K-4K/4K-4K/4K-4K, ioengine=sync, iodepth=1
fio-2.1.5
Starting 1 process
Jobs: 1 (f=1)
Jobs: 1 (f=1): [r] [15.8% done] [14808KB/0KB/0KB /s] [3702/0/0 iops] [eta 00m:16s]
Jobs: 1 (f=1): [r] [22.2% done] [16144KB/0KB/0KB /s] [4036/0/0 iops] [eta 00m:14s]
Jobs: 1 (f=1): [r] [29.4% done] [16920KB/0KB/0KB /s] [4230/0/0 iops] [eta 00m:12s]
Jobs: 1 (f=1): [r] [35.3% done] [16688KB/0KB/0KB /s] [4172/0/0 iops] [eta 00m:11s]
Jobs: 1 (f=1): [r] [41.2% done] [15428KB/0KB/0KB /s] [3857/0/0 iops] [eta 00m:10s]
Jobs: 1 (f=1): [r] [47.1% done] [16232KB/0KB/0KB /s] [4058/0/0 iops] [eta 00m:09s]
Jobs: 1 (f=1): [r] [52.9% done] [16208KB/0KB/0KB /s] [4052/0/0 iops] [eta 00m:08s]
Jobs: 1 (f=1): [r] [58.8% done] [14892KB/0KB/0KB /s] [3723/0/0 iops] [eta 00m:07s]
Jobs: 1 (f=1): [r] [64.7% done] [16392KB/0KB/0KB /s] [4098/0/0 iops] [eta 00m:06s]
Jobs: 1 (f=1): [r] [70.6% done] [16036KB/0KB/0KB /s] [4009/0/0 iops] [eta 00m:05s]
Jobs: 1 (f=1): [r] [76.5% done] [17300KB/0KB/0KB /s] [4325/0/0 iops] [eta 00m:04s]
Jobs: 1 (f=1): [r] [82.4% done] [16436KB/0KB/0KB /s] [4109/0/0 iops] [eta 00m:03s]
Jobs: 1 (f=1): [r] [88.2% done] [14764KB/0KB/0KB /s] [3691/0/0 iops] [eta 00m:02s]
Jobs: 1 (f=1): [r] [94.1% done] [15028KB/0KB/0KB /s] [3757/0/0 iops] [eta 00m:01s]
Jobs: 1 (f=1): [r] [100.0% done] [16340KB/0KB/0KB /s] [4085/0/0 iops] [eta 00m:00s]
実行結果
sample: (groupid=0, jobs=1): err= 0: pid=28707: Sun Feb 21 06:08:29 2016
  read : io=262144KB, bw=15935KB/s, iops=3983, runt= 16451msec
    clat (usec): min=166, max=41865, avg=249.06, stdev=375.48
     lat (usec): min=166, max=41866, avg=249.25, stdev=375.48
    clat percentiles (usec):
     |  1.00th=[  179],  5.00th=[  185], 10.00th=[  187], 20.00th=[  191],
     | 30.00th=[  195], 40.00th=[  199], 50.00th=[  205], 60.00th=[  211],
     | 70.00th=[  219], 80.00th=[  235], 90.00th=[  290], 95.00th=[  422],
     | 99.00th=[  908], 99.50th=[ 1400], 99.90th=[ 3920], 99.95th=[ 5792],
     | 99.99th=[15936]
    bw (KB  /s): min=13600, max=18096, per=100.00%, avg=15957.00, stdev=1212.90
    lat (usec) : 250=84.46%, 500=12.32%, 750=1.75%, 1000=0.61%
    lat (msec) : 2=0.54%, 4=0.22%, 10=0.08%, 20=0.01%, 50=0.01%
  cpu          : usr=0.32%, sys=5.01%, ctx=65576, majf=0, minf=6
  IO depths    : 1=100.0%, 2=0.0%, 4=0.0%, 8=0.0%, 16=0.0%, 32=0.0%, >=64=0.0%
     submit    : 0=0.0%, 4=100.0%, 8=0.0%, 16=0.0%, 32=0.0%, 64=0.0%, >=64=0.0%
     complete  : 0=0.0%, 4=100.0%, 8=0.0%, 16=0.0%, 32=0.0%, 64=0.0%, >=64=0.0%
     issued    : total=r=65536/w=0/d=0, short=r=0/w=0/d=0
     latency   : target=0, window=0, percentile=100.00%, depth=1

Run status group 0 (all jobs):
   READ: io=262144KB, aggrb=15934KB/s, minb=15934KB/s, maxb=15934KB/s, mint=16451msec, maxt=16451msec

Disk stats (read/write):
  xvda: ios=65380/0, merge=0/0, ticks=16068/0, in_queue=16064, util=97.36%
実行結果パラメータの意味
- ジョブ単位での結果
| パラメータ名 | 原文 | 解釈 |
|---|---|---|
| io | Number of megabytes io performed | 何バイト分ディスク読み書きしたかを表す |
| bw | Average bandwidth rate | 平均の帯域幅。 |
| iops | Average IOs performed per second | ディスクが1秒当たりに処理できるI/Oアクセスの数である。 IOPSが高ければ高いほど,高性能なディスクと言える。 1回のI/O処理にかかる時間は,平均アクセス時間と データ転送時間を足した数値。 このI/O処理が1秒当たり何回実行できるかがIOPSである 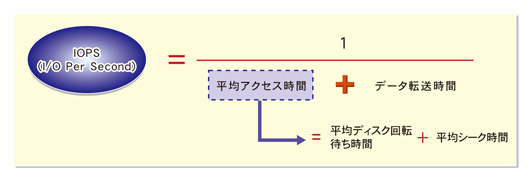 |
| runt | The runtime of that thread | 処理実行時間。 |
| slat | Submission latency (avg being the average, stdev being the standard deviation). This is the time it took to submit the io. For sync io, the slat is really the completion latency, since queue/complete is one operation there. This value can be in milliseconds or microseconds, fio will choose the most appropriate base and print that. In the example above, milliseconds is the best scale. Note: in --minimal mode latencies are always expressed in microseconds. |
Submission latency。リクエスト送信までの遅延時間 |
| clat | Completion latency. Same names as slat, this denotes the time from submission to completion of the io pieces. For sync io, clat will usually be equal (or very close) to 0, as the time from submit to complete is basically just CPU time (io has already been done, see slat explanation). |
completeion latency。リクエスト送信から終了までの遅延時間 |
| bw | Bandwidth. Same names as the xlat stats, but also includes an approximate percentage of total aggregate bandwidth this thread received in this group. This last value is only really useful if the threads in this group are on the same disk, since they are then competing for disk access. |
帯域幅。 |
| cpu | CPU usage. User and system time, along with the number of context switches this thread went through, usage of system and user time, and finally the number of major and minor page faults. |
CPU使用率 |
| IO depths | The distribution of io depths over the job life time. The numbers are divided into powers of 2, so for example the 16= entries includes depths up to that value but higher than the previous entry. In other words, it covers the range from 16 to 31. |
実行時のリクエスト待機状態。submit 以下の行は、IOリクエストまでに要したレイテンシ情報。 |
| IO submit | How many pieces of IO were submitting in a single submit call. Each entry denotes that amount and below, until the previous entry - eg, 8=100% mean that we submitted anywhere in between 5-8 ios per submit call. |
? |
| IO complete | Like the above submit number, but for completions instead. |
? |
| IO issued | The number of read/write requests issued, and how many of them were short. |
? |
| IO latencies | The distribution of IO completion latencies. This is the time from when IO leaves fio and when it gets completed. The numbers follow the same pattern as the IO depths, meaning that 2=1.6% means that 1.6% of the IO completed within 2 msecs, 20=12.8% means that 12.8% of the IO took more than 10 msecs, but less than (or equal to) 20 msecs. |
? |
- グループ単位(Run status group)での結果
| パラメータ名 | 原文 | 解釈 |
|---|---|---|
| io | Number of megabytes io performed. | 何バイト分ディスク読み書きしたかを表す |
| aggrb | Aggregate bandwidth of threads in this group. | 帯域幅のグループ集計 |
| minb | The minimum average bandwidth a thread saw. | 最小帯域幅 |
| maxb | The maximum average bandwidth a thread saw. | 最大帯域幅 |
| mint | The smallest runtime of the threads in that group. | 最小実行時間 |
| maxt | The longest runtime of the threads in that group. | 最大実行時間 |
- ディスク単位(Disk stats (read/write))での結果
| パラメータ名 | 原文 | 解釈 |
|---|---|---|
| ios | Number of ios performed by all groups. | 何バイト分ディスク読み書きしたかを表す |
| merge | Number of merges io the io scheduler. | 解釈 |
| ticks | Number of ticks we kept the disk busy. | リクエストがキューに入っていた数 |
| io_queue | Total time spent in the disk queue. | リクエストがキューに入っていた時間 |
| util | The disk utilization. A value of 100% means we kept the disk busy constantly, 50% would be a disk idling half of the time. |
ディスクアイドル時間(数が多いほどよくディスクを利用できていることになる) |